Viewer
react-render-pulse-viewer reads stored batches and shows where render time goes: the slowest areas, routes, device classes and connection types, and trends by day and app version. It has a terminal report and a local web viewer. It needs Node 20 or later and only reads data.
npm install --save-dev react-render-pulse-viewer
# or run it without installing
npx react-render-pulse-viewer --help
Commands
react-render-pulse-viewer report <file>         Print a report from a JSON or JSON Lines export
react-render-pulse-viewer report --db <url>     Print a report from Postgres
react-render-pulse-viewer serve --db <url>      Open the web viewer on Postgres data
react-render-pulse-viewer serve --file <file> Open the web viewer on a file| Flag | Applies to | Description |
|---|---|---|
--since <duration> | report | Only batches received in the last 7d, 24h, 30m, etc. (whole numbers of days, hours or minutes). |
--app-version <ver> | report | Only batches from this app version, or unknown for batches sent without one. |
--limit <n> | report | Rows per table. Default 15. The app versions table keeps the most recent ones. |
--json | report | Print the full report as JSON instead of tables. |
--table <name> | --db | Postgres table. Default render_pulse_batches. |
--port <n> | serve | Port. Default 4173. |
--host <host> | serve | Interface to bind. Default 127.0.0.1. |
-h, --help | Show help. |
react-render-pulse-viewer <file> is shorthand for report <file>. With --db, the viewer never creates or changes tables.
Files it reads
report <file> and serve --file <file> accept any of:
- A JSON Lines file of stored batches, as written by
jsonFileStorage. - A JSON array of stored batches (
{ receivedAt, payload }) or of raw payloads. - A single payload, for example one copied from the browser console.
Raw payloads use their session.sentAt as the received time. Blank and corrupt lines are skipped, so a partly written last line doesn't hide the rest. serve --file re-reads the file on every request, so new batches show up when you refresh.
The terminal report
npx react-render-pulse-viewer report --db "$DATABASE_URL" --since 7dThe report starts with the date range and headline numbers: sessions, renders, the share of slow renders, the overall p75 render time, and long tasks per session. Then come these tables:
- Slowest areas (by p75): one row per area and route, with renders, slow %, p50/p75/p95, max, and long tasks attributed to the area.
- Routes: the same timings per route across all areas, and long tasks per session on that route.
- Devices (memory · cores): device classes such as
4 GB · 8 cores. Unknown values show as?. - Connections: by
effectiveType(4g,3g, ...), orunknown. - App versions: only when the data has more than one, oldest first by when each version was first received.
If clients dropped areas because of maxAreas or maxPayloadBytes, a note at the end says how many.
--json prints the whole Report object (see the viewer API), which is handy for scripts and CI checks:
npx react-render-pulse-viewer report data/render-pulse.jsonl --json > report.jsonThe web viewer
npx react-render-pulse-viewer serve --db "$DATABASE_URL"
# render-pulse viewer on http://127.0.0.1:4173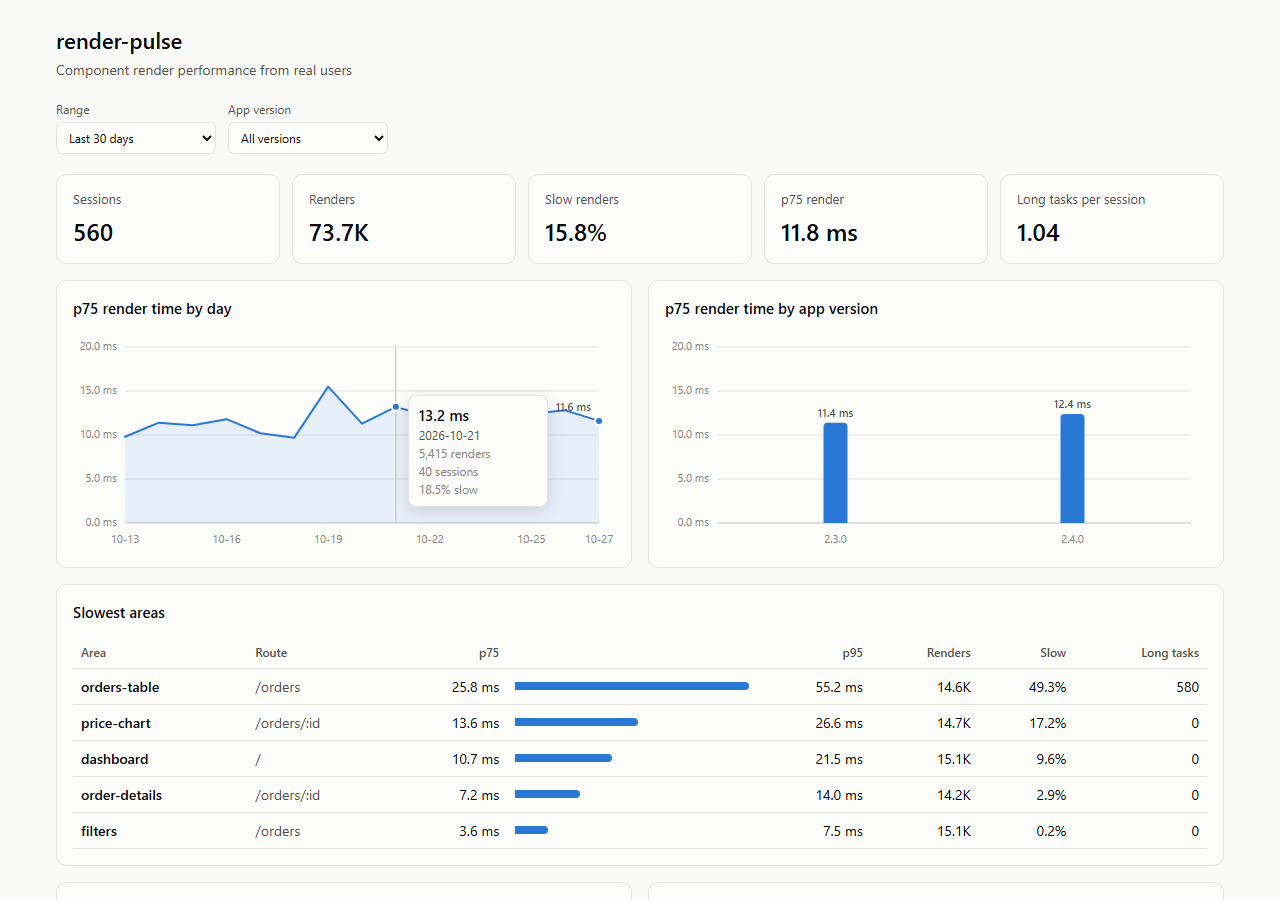
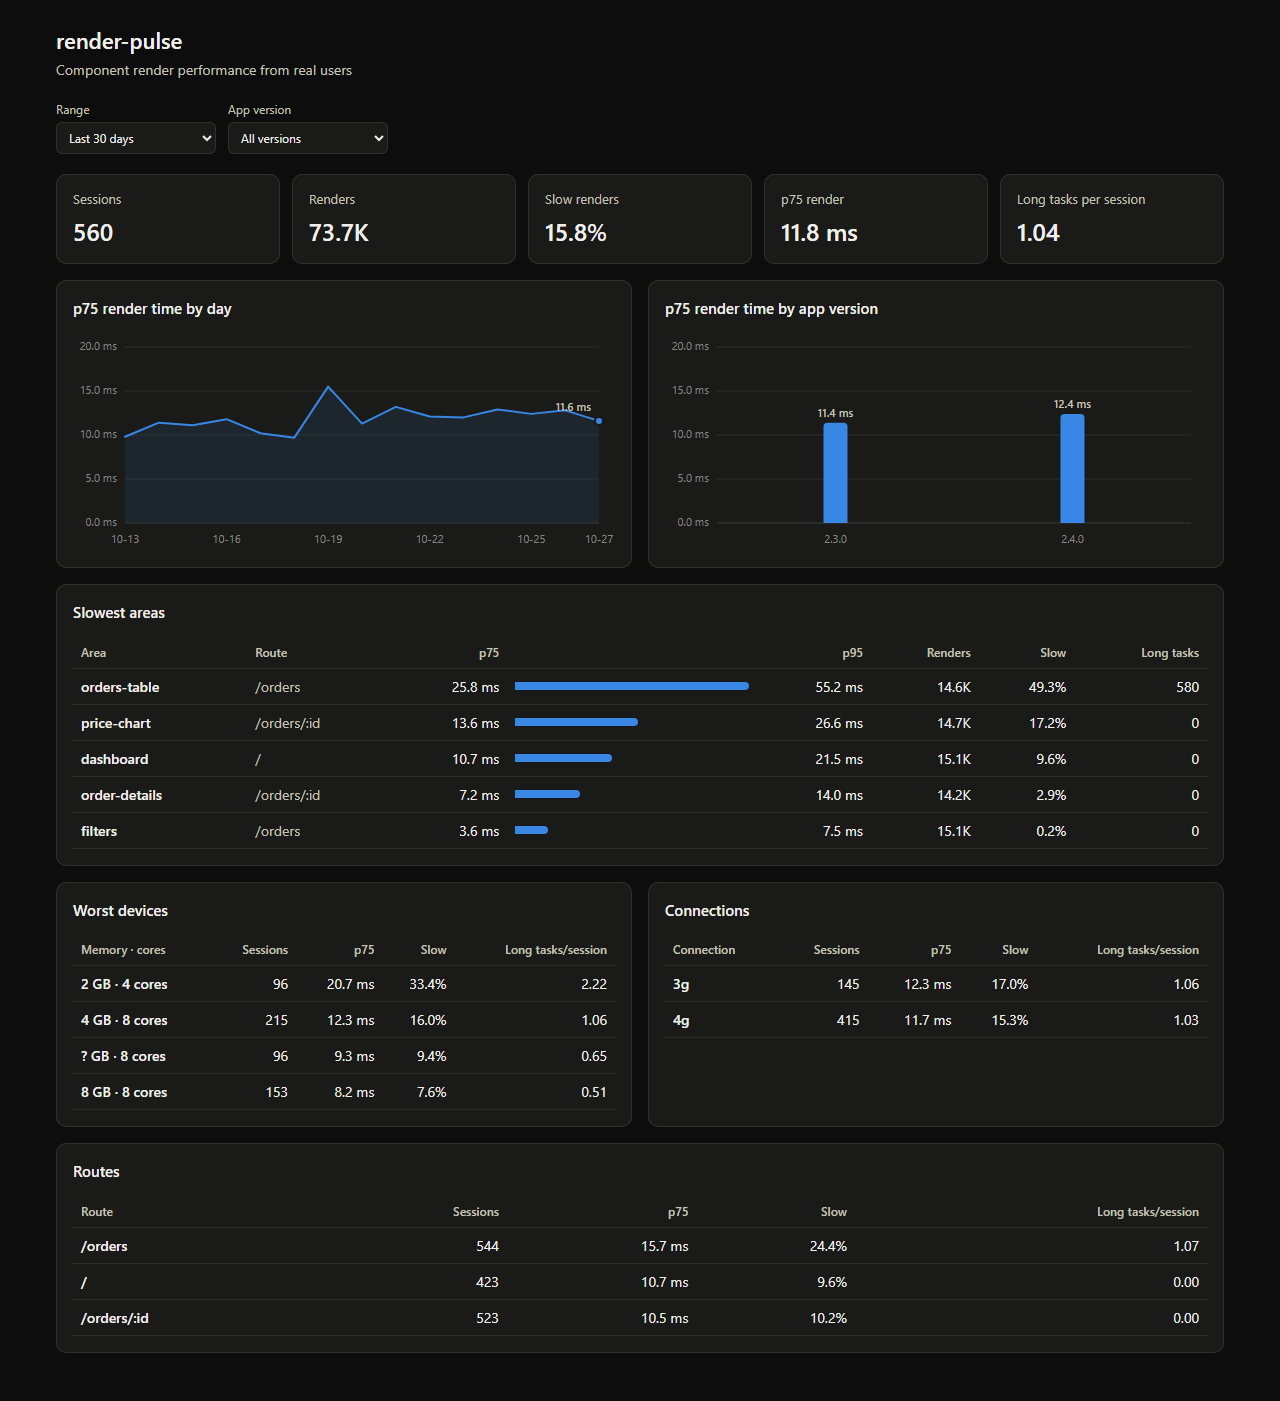
It shows:
- Tiles for sessions, renders, slow-render share, p75 render time and long tasks per session.
- p75 render time by day, and by app version.
- The 25 slowest areas, with p75, p95, renders, slow % and long tasks.
- The 10 worst device classes, and connection types.
- The 25 slowest routes.
Filter by range (last 7, 30 or 90 days, or all time; 30 days by default) and by app version. The --since and --app-version flags are for report only; in the web viewer, use these filters.
Try it with demo data
The viewer package includes a script that writes two weeks of synthetic batches (two app versions, a spread of devices), so you can try the viewer without a site. From packages/viewer in the repository, after pnpm build:
node scripts/demo-data.mjs demo.jsonl
node dist/cli.js serve --file demo.jsonl
All numbers in it are made up.
The server binds to 127.0.0.1 by default, because reports aren't meant to be public. Use --host 0.0.0.0 only on a trusted network or behind authentication. It answers GET requests only: the page and GET /api/report?since=30d&version=2.4.0.
How the numbers are computed
- Percentiles come from merging the per-batch histograms bucket by bucket, then estimating the percentile within the bucket. Averaging per-batch percentiles would be wrong, so the viewer never does. Estimates are kept within the fastest and slowest renders observed.
- Slow is the share of renders slower than the client's
slowRenderMs(16 ms by default) at the time they were measured. - Sessions counts distinct session ids, that is, page loads.
- Long tasks/session is long tasks divided by sessions in that group. Long animation frames aren't included in these counts.
- Lists are sorted slowest first by p75, then by render count.
Acting on findings
Read the report top down, and weigh each row by how often it happens.
- Start with areas that are both slow and frequent. A p75 of 40 ms on an area with thousands of renders hurts more than a 200 ms max on one that renders once. High p75 and a high slow % mean most users feel it.
- Check whether it's mounts or updates. If an area is slow mainly on mount (compare
mountswithrendersin--json, and thephaseof worst cases in the raw payloads), look at the initial data size, lazy loading, or virtualizing long lists. If updates are slow, look for unnecessary re-renders: unstable props, context that changes too often, missingmemo, or state lifted too high. - Look at long tasks per area. Long tasks attributed to an area mean its renders block the main thread long enough to delay input. Split the work, defer it with
useDeferredValueorstartTransition, or move it out of render. - Compare devices. If the slowest device classes are far behind, the problem is CPU-bound work that's fine on fast machines. Profile with CPU throttling in DevTools to reproduce it.
- Narrow it down with nesting. If a page-level area is slow but none of its inner areas are, add monitors around its other children for a release.
- Confirm the fix by version. Set
appVersion, ship the change, and compare the p75 for the area across versions with--app-versionor the version chart.
Remember the limits of lightweight mode: it doesn't see updates that start inside an area, and hook durations are upper bounds. See Modes.