Component level
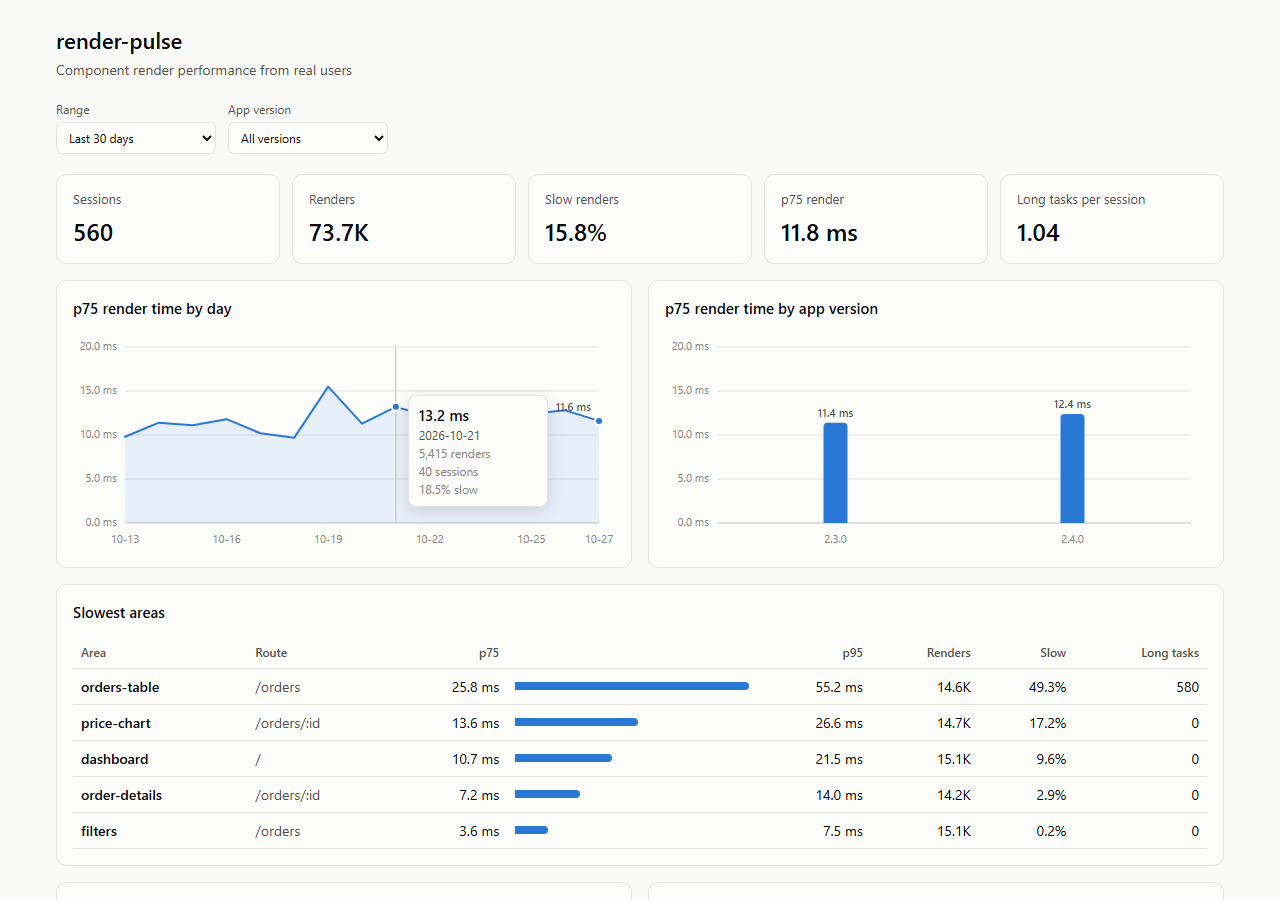
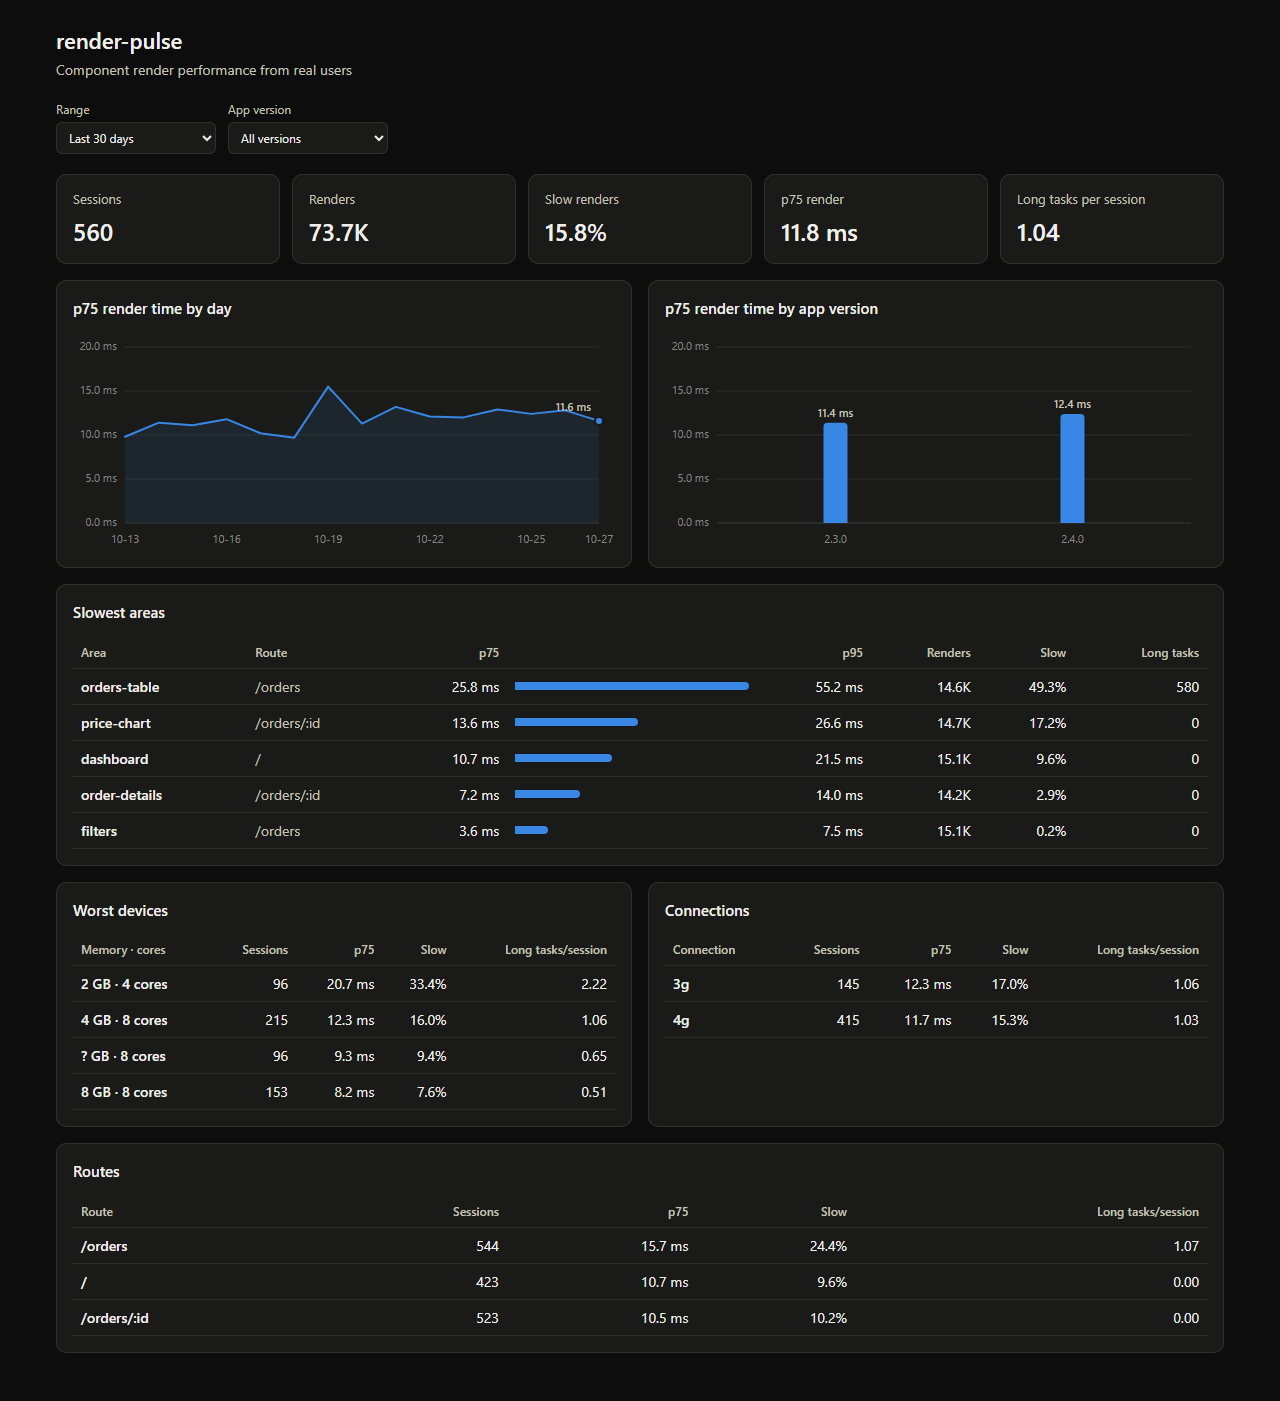
Name areas with the RenderMonitor component or the useRenderMonitor hook. Reports show render counts, slow renders, p50/p75/p95 and the slowest renders for each area and route.
Wrap the parts of your React tree you care about and see how long they take to render on your users' devices, not just your laptop.
npm install react-render-pulseimport { createRoot } from "react-dom/client";
import { initRenderPulse, RenderMonitor } from "react-render-pulse";
import { OrdersTable } from "./OrdersTable";
initRenderPulse({ endpoint: "/api/render-pulse", sampleRate: 0.1 });
createRoot(document.getElementById("root")!).render(
<RenderMonitor id="orders-table">
<OrdersTable />
</RenderMonitor>,
);Without an endpoint, each batch is logged to the browser console instead, which is the quickest way to try it. Then deploy a collector and read the reports.
A performance tool has to show its own cost. In the benchmark, lightweight mode adds about 10–15 µs per measured render. Profiling mode costs more, and almost all of that comes from React's profiling build itself: a bare <Profiler> costs nearly the same. Performance has the full results, how to reproduce them, and the bundle-size budget.